vFC™ Assays and vCal™ Standards
Vesicle Flow Cytometry (vFC™) is a standardized assay, supplied as a kit for characterizing extracellular vesicles such as exosomes and microvesicles, by size, concentration, and surface cargo. When performed on a calibrated flow cytometer, vFC™ provides sensitive, specific, and reproducible measurements with a simple workflow that does not require extensive sample processing.
The assay is high throughput, run in 96 well plates, and includes relevant standards and controls to ensure accurate measurements and EV specificity. It can be run on commercially available flow cytometers with sensitivity down to 40nm EVs with cargo detection down to <10 molecules per vesicle depending upon the flow cytometer being used to collect the data. You can rely on the accuracy of this assay for critical measurements such as titrating doses of therapeutic vesicle preps. It is the subject of several publications and is validated in hundreds of thousands of samples over numerous collaborations with academic and pharmaceutical labs.

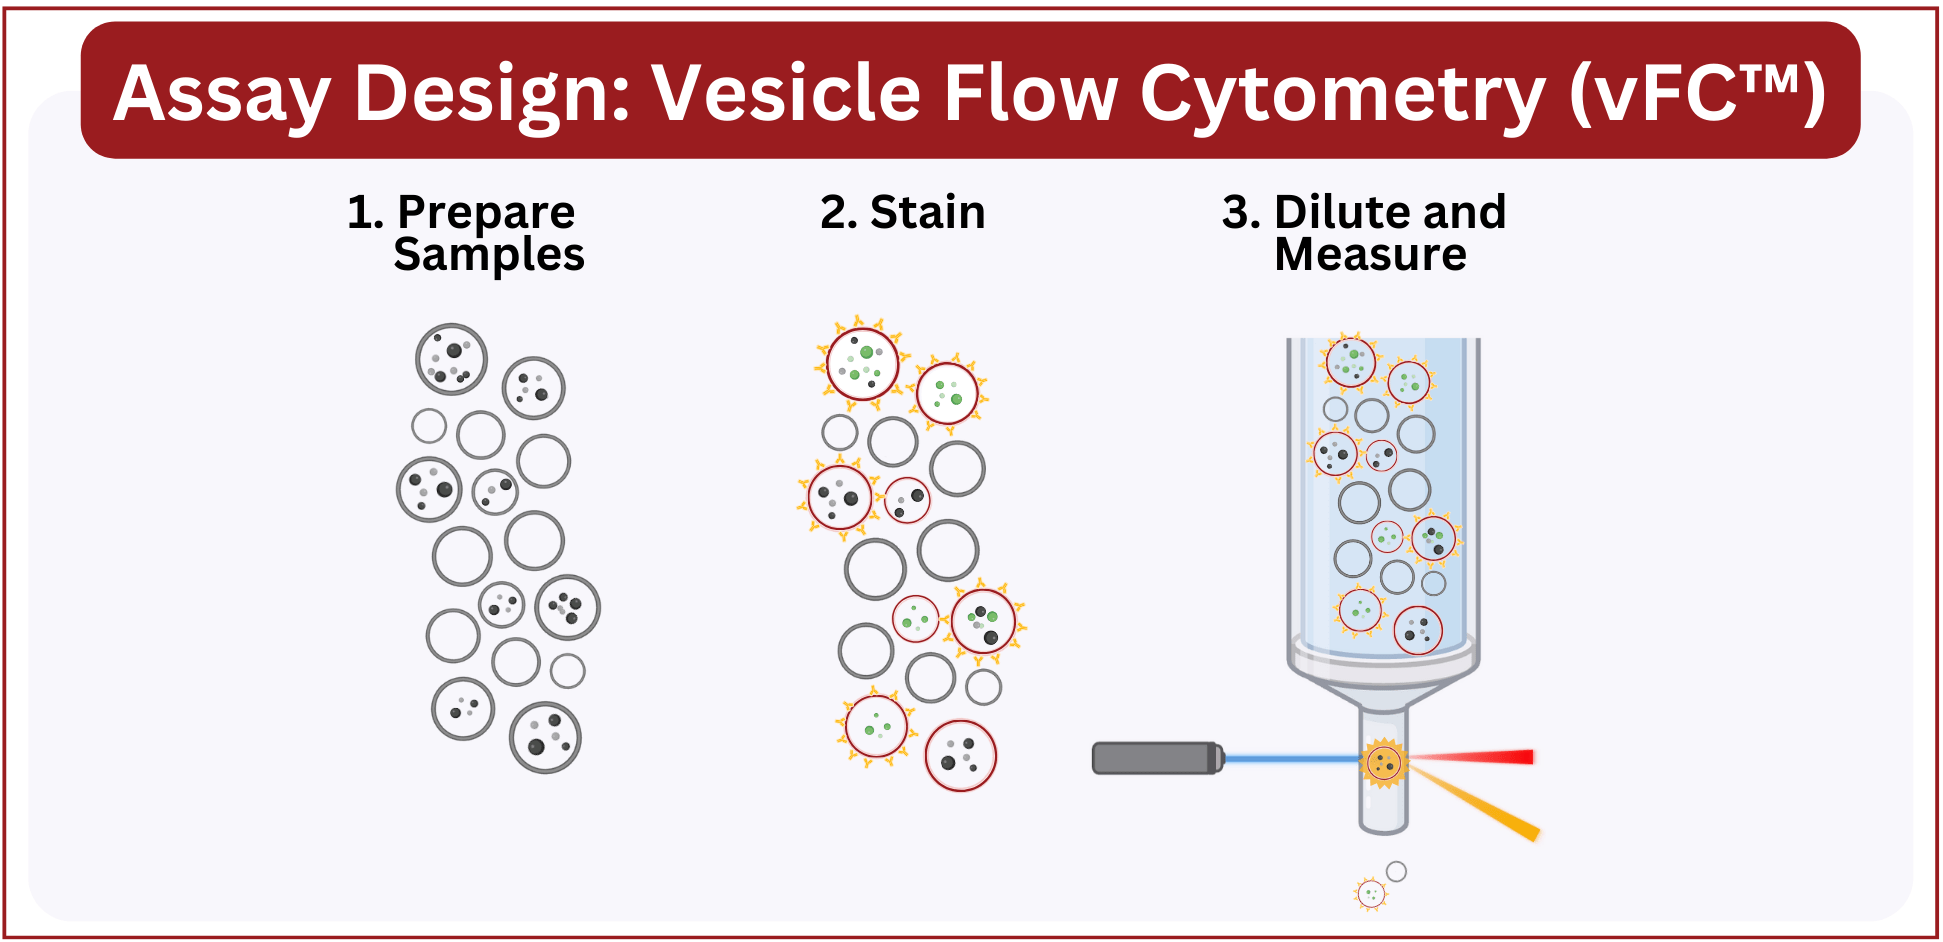
Running vFC™ is simple. Once samples have been collected and processed as required for your experiment it’s a three step protocol, much like setting up and running an ELISA:
- 1. Prepare your samples. In most cases, the only sample preparation is dilution into the staining wells, however vFC™ is compatible with samples prepared by all popular EV enrichment methods.
2. Add samples and controls to the appropriate wells, add staining reagents, and incubate 1 hr at room temperature.
3. After staining, dilute the samples and analyze on a suitable flow cytometer. vFC™ is a no-wash assay, which enables automation while avoiding artifacts and biases that can be introduced by post-stain sample processing.
vFC™: Navigating the Protocols

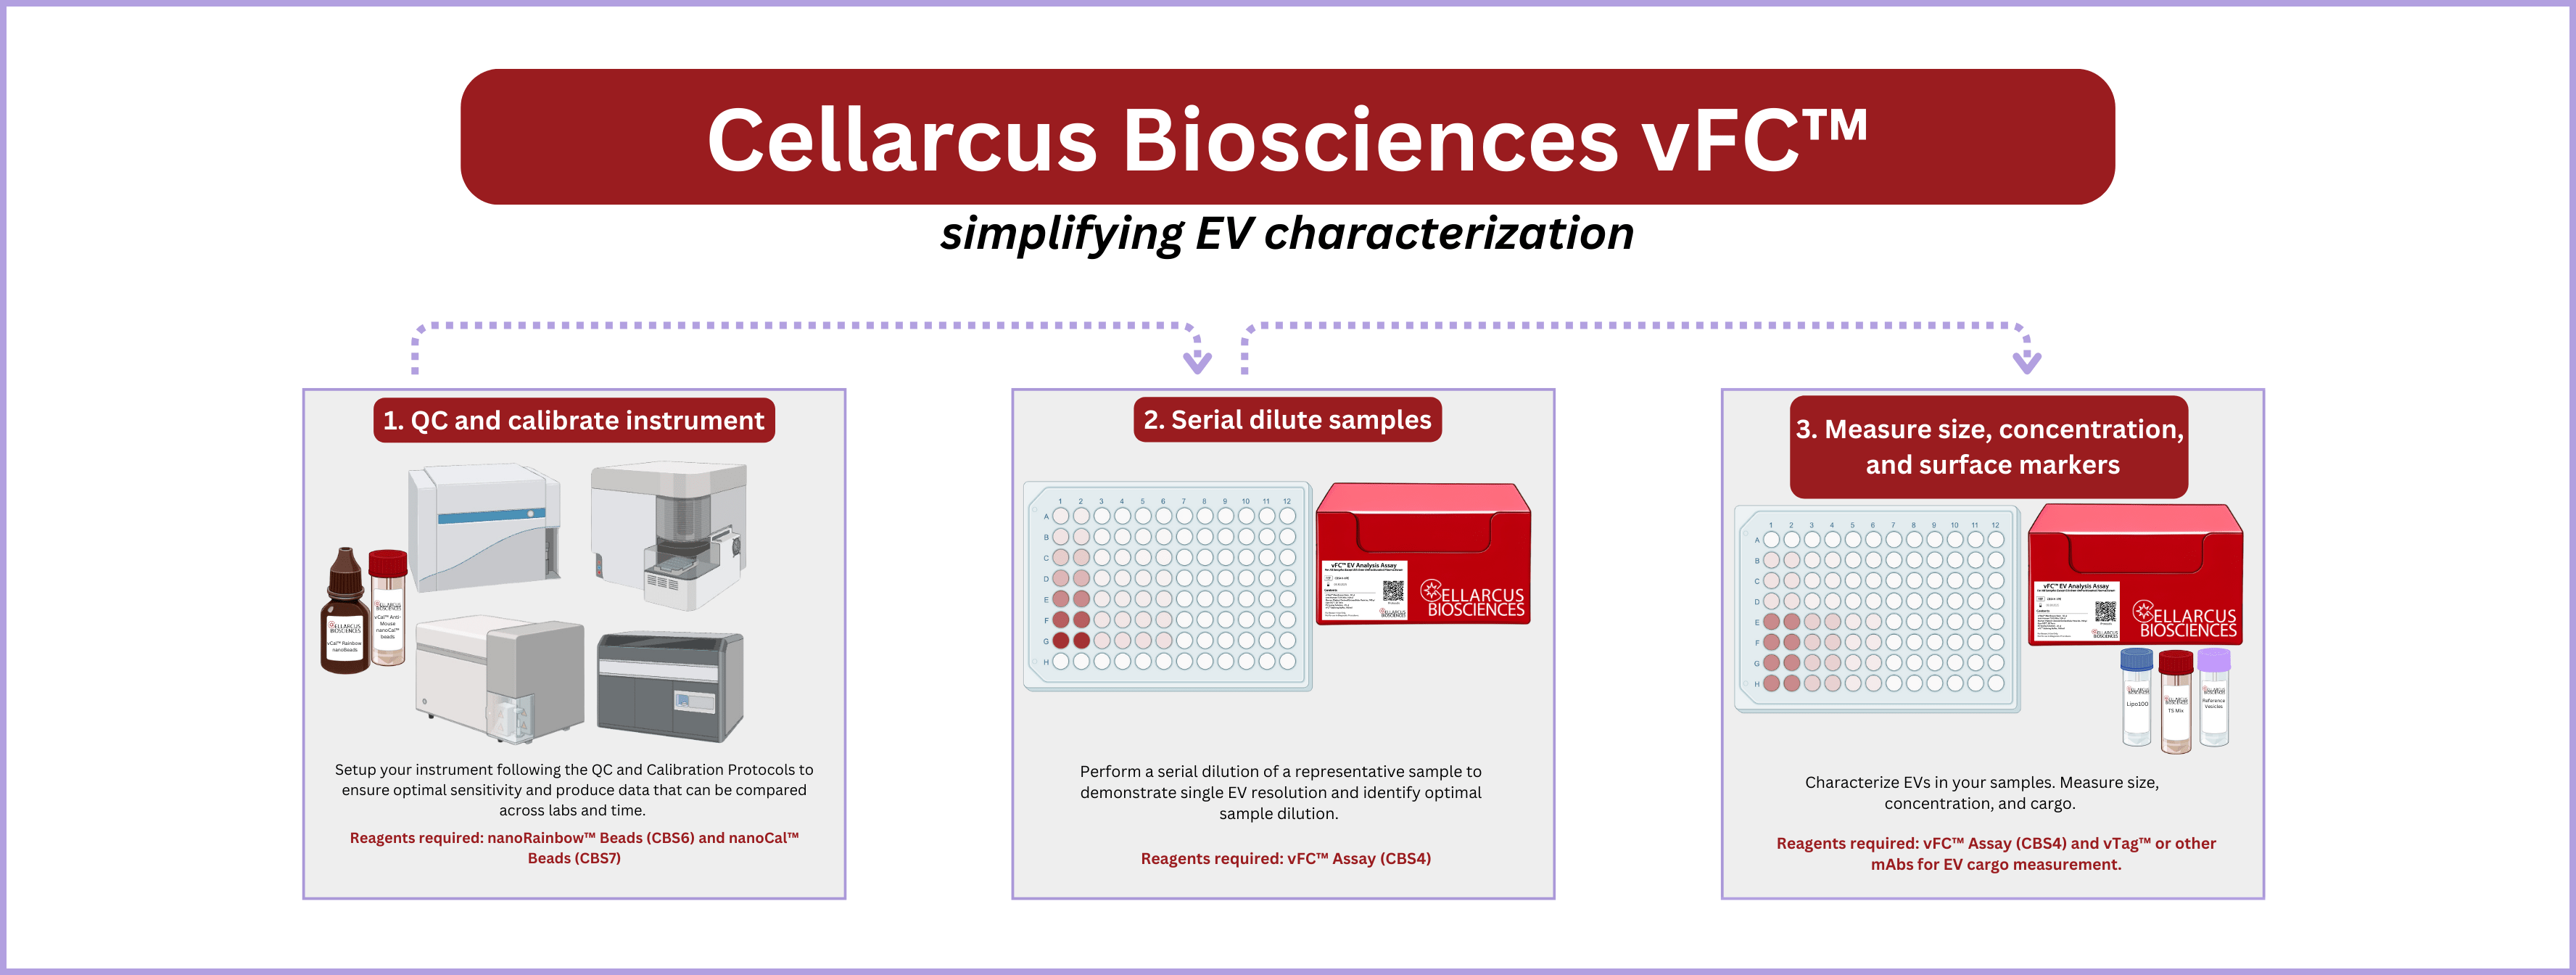
vFC™ includes three protocols that we recommend running in order:
1. Instrument QC and Calibration. Before running vFC™, we recommend that you qualify and calibrate your instrument. vCal™ nanoRainbow Beads, nanoCal Antibody Capture Beads, and Lipo100™ Vesicle Size Standard, used with the accompanying protocols, allow you to determine the sensitivity of your instrument and ensures that your results will be comparable between labs and instruments and over time. Typically, full calibration is only required at instrument set-up, after which instrument stability can be measured periodically using nanoRainbow beads.
2. Sample Serial Dilution. When first running a new sample type in vFC™ we recommend performing a serial dilution of the sample. The serial dilution will provide a recommended pre-stain dilution for your samples. It will also demonstrate single EV resolution at that dilution as recommended in various guidelines. Typically, sample serial dilution only needs to be run once per new sample type on a representative sample.
3. EV Measurement. The final step is measurement of EV size, concentration, and surface markers or other cargo. The vFC Assay kit contains the controls, reagents and instructions to measure single EV number, size and cargo in a rigorous and reproducible manner. vFC assays can be configured for immunofluorescence measurements of up to ten different surface markers using our validated vTag™ antibodies, or use your own antibodies, fluorescent protein, or other cargo-tagging strategies.
When run on a calibrated instrument, the vFC assay provides EV measurements that are interpretable, reproducible, and compliant with all the guidelines recommended by leading societies and quality journals.
Included with vFC™ Assay Kits (sizes for single plate kit)
| Included with All Kits | |
| 100 Tests | vFRed™ |
| 5 Tests | Lipo100™ Vesicle Standard |
| 25 µL | Vesicle Lysing Solution |
| 100 mL | vFC™ Staining Buffer |
| Optionally | |
| 100 Tests | vTag™ Anti-Human Tetraspanin (CD9, CD63, CD81) Cocktail [Multiple Conjugates Available] |
| 5 Tests | vRP™ Tetraspanin Positive Control EVs |
vFC™ FAQs
What are the recommended flow cytometers for vFC™?
vFC™ requires modern flow cytometers with improved sensitivity over previous generations of lymphocyte analyzers. Currently, the Beckman Coulter CytoFlex™, Cytek® Aurora, Cytek® Northern Lights, Cytek® CellStream, and Cytek® ImageStream provide suitably sensitive optics for vFC™. Other modern flow cytometers are likely suitable for vFC™. We are in the process of qualifying additional flow cytometers for our assay and will include performance information including LOD for vesicle size, concentration, and surface marker immunofluorescence.
How is vFC™ different from NTA (e.g. NanoSight™)
vFC™ and NTA are vesicle characterization technologies based on different detection platforms. vFC™ is a set of reagents including all calibrators and standards designed for analyzing vesicles on modern flow cytometers. NTA is specialized instrumentation for sizing particles that is also used for vesicle analysis.
Because NTA was designed for sizing particles, it has many limitations in vesicle analysis. In general, it is imprecise when estimating vesicle concentration. It also lacks the fluorescence sensitivity to detect antibody labeled vesicles.
vFC™ solves these problems with concentration estimates that are over 5-fold more precise as well as greatly enhanced fluorescence sensitivity (current limit of detection is 10 molecules/vesicle).
Other advantages of vFC™
- Vesicle specificity (NTA measures any particle, not just vesicles)
- Throughput (vFC™ is capable of processing 100s of samples per day)
For more information see our page on NTA.
How does vFC™ compare to RPS (resisitive pulse sensing)?
RPS estimates size by measuring impedance of an electrical current as a particle passes through a pore. Unlike other methods that rely upon light scatter such as NTA and conventional flow cytometry, size estimates made by RPS do not depend upon the refractive index of a particle.
Compared to vFC™, RPS lacks EV specificity and is not suitable for surface cargo measurement. It is a useful orthogonal approach for measuring vesicle size. RPS is one approach to measuring size that Cellarcus uses to provide size estimates for its size standards.
How does vFC™ compare to EM (electron microscopy)?
EM was once the gold standard for EV analysis due to it’s ability to resolve very small particles. While it is still useful as an orthogonal method for experiments where detecting the smallest EVs or the dimmest cargo is important, low throughput and limited ability to measure multiple markers makes it challenging to implement routinely.
How does vFC™ compare to super resolution microscopy?
Super-resolution microscopy is being commercialized for EV measurement by ONI. Super res. is similar to EM in that it is an imaging-based approach and is very sensitive, but unlike EM it cannot visualize unlabeled EVs. It is low throughput and lacks standardization, like other methods in the EV field. Super res. relies on immobilization of EVs to a slide which again, will not capture all EVs. EV size determination is based on estimating the diameter of clusters of antibodies which is problematic for EVs expressing markers at low abundance and could be affected by marker expression patterns which differ from EV to EV. It is, however, very sensitive, and it is a useful visualization tool which can be used as a complement to other methods.
How does vFC™ compare to SP-IRIS (such as Leprechaun)?
SP-IRIS (eg. Leprechaun) is a new entrant in the small particle characterization. It offers improved cargo measurement capabilities to NTA and RPS and is better tailored to small particle measurement than conventional flow cytometry. However, SP-IRIS suffers from a similar low throughput to NTA and RPS and lacks standardization like other approaches. SP-IRIS is also not capable of measuring all EVs in a sample. Biological EV surface antigen profiles are very heterogeneous both within and between different cell types yet, SP-IRIS relies on immunocapture of EVs which misses all EVs not expressing a given surface marker. Due to its antigen specificity, it is, perhaps, well suited as an orthogonal approach for rare event detection, but not likely useful for characterization and QC of functional/therapeutic EV preparations.
How does vFC™ compare to other flow cytometry-based methods?
Other approaches to using a flow cytometer for EV measurement are reported in the literature. These approaches either fall into use of various fluorescent stains for EV detection or EV detection by light scatter.
Reports describing various fluorescent stains to detect EVs are limited by dye artifacts and other sources of background, poor standardization, and inability to provide size measurements, all of which are addressed by running vFC™. vFC™ relies on similar principles, triggering on a fluorescent lipophilic dye, vFRed™. However, vFRed™ is well-characterized, formulated to minimize various sources of background and stain EVs uniformly. Additionally, vFRed™ is used within the framework of an assay that incorporates necessary standards and controls to eliminate many of the uncertainties of these other reported methods and to provide an estimate of EV-diameter, an important metric for comparing data across instruments, labs, and time.
Reports describing light scatter are more developed, however, light scatter-based detection and sizing has several drawbacks. Principally, light scatter-based detection is less sensitive than fluorescence-based detection due to higher backgrounds. Light scatter-based detection will detect all particles and lacks any sort of EV specificity. Laborious maintenance of pristine instrumentation is often required to address these backgrounds. Additionally, light scatter-based measurement of diameter is impacted by refractive index (RI) which is heterogenous. Assumptions of refractive index are required for determination of diameter which results in uncertainty and underlies reports of phantom EV subpopulations. Finally, there is no standardized, consensus method for light scatter based EV characterization. vFC™ addresses these issues by triggering on vFRed™ which mitigates background concerns, provides an additional level of specificity, and estimates diameter independent of RI. It is a simple, standardized, highly published method for characterizing EVs.
Should I measure cargo via ELISA or Western Blot?
No. In the past there were no methods with sufficient sensitivity to measure cargo on individual EVs. The field relied upon bulk measurements such as western blot or ELISA to confirm the presence of particular markers in enriched fractions of EVs. However, methods for enriching EVs are variable. There is no method that results in a “pure” population of EVs. Bulk measurements of EV cargo, therefore, suffer from specificity issues. Furthermore, they provide no information on the distribution of cargo among EVs or the co-expression of markers together on the same EV.
While bulk EV methods for -omics measurements still have their place as there is now suitable single EV counterpart, modern approaches to EV characterization should avoid legacy methods such as ELISA and western blot.
EV Measurement Methods Summary
Methods for single EV analysis are summarized below. In general, there are strengths and weaknesses to each method. Upon examining the chart, it is clear that flow cytometry is the most useful across all categories. Our recommendation is to approach EV characterization employing flow cytometry as your primary method and reflex to other methods as necessary. vFC™ greatly simplifies running flow cytometry for EV analysis and is summarized in greater detail above.
| Technologies | Metrics | Parameters | Commercial Vendors | ||||||||||
|---|---|---|---|---|---|---|---|---|---|---|---|---|---|
| Speed | Throughput | Scale | Specificity | Specificity LOD | Sensitivity | Sensitivity LOD | EV Detection | EV Size | EV Concentration | Cargo Number | |||
| Single Particle Analysis | |||||||||||||
| Electron microscopy (TEM/CryoEM) | Single | Analysis | Solid/Fluid | Low | Low | Low | High | High | Med | High | Med | High | TEM, SEM, Cryo-EM, AFM (Thermo, FEI, others) |
| Optical imaging (OI) | Single | Analysis | Solid | Low | Low | Low | High | High | Med | Med | Med | Med | ARC (Spectradyne), qSMLM (ONI), Exoview (Unchained labs), ARC (Spectradyne) |
| Nanoparticle Tracking Analysis (NTA) | Single | Analysis | Fluid | Med | Med | Med | Med | Low | Med | Low | Low | Low | NanoSight NS300 (Malvern), ZetaView (Particle Metrix), Envision3 (Hyperion), MANTA (Bruker) |
| Resistive pulse sensing (RPS) | Single | Analysis | Fluid | Med-High | Med-High | Low | Med | Low | Med | Low | Med | Med | nCS1 (Spectradyne), Exoid (Izon), ARC (Spectradyne) |
| Flow cytometry (FC) | Single | Analysis | Fluid | Med | Med-High | Low | High | High | Med | Med | Med | High | CytoFlex (Beckman), Astrios EQ (Beckman), CellStream (Luminex), ImageStream (Luminex), Aurora (Cytek), Symphony (BD), A-60 MICRO-PLUS (Apogee), NanoAnalyzer (NanoFCM), vFC (Cellarcus) |
| Flow cytometry-based sorting | Single | Fract/Analysis | Fluid | Low | Low | Med | High | Low | Med | Med | Med | Low | Beckman Astrios, BD FACSAria |
vCal™ Beads for Instrument QC and Calibration
The first step to analyzing vesicles is to evaluate and set up your instrument. We provide nanoRainbow Beads for instrument evaluation and QC and vCal™ calibrated antibody capture beads to perform fluorescence calibration. Using these beads according to protocol ensures reproducible measurements and allows EV researchers to convert their data into meaningful units.
Lipo100™ and Other Synthetic Vesicles
We provide Lipo100™ synthetic liposomes of known size distribution as standards for consistent, accurate estimate of vesicle size. These standards are, additionally, negative for all markers and are suitable as a negative control for vesicle cargo measurement. They are included with all vFC™ kits.
vRP™ Marker Specific Positive Control Samples
When possible, our vTag™ antibodies are sold with (include) a vesicle Reference Prep (vRP™) expressing a marker of interest. These are well-characterized populations of vesicles either engineered or natively expressing a target. Positive support interpretation of negative events by ensuring that the antibody staining worked whether measurements were performed by vFC™ or other methods.
Data analysis layouts are available for FCS Express to guide your interpretation of vFC™ results. For more information, download the templates from the assay webpage.

